Surface Anomaly Detector

|
This tool requires a special dongle and license to function with live sensor data. (Available for purchase from LMI.) You must also install the dongle's supporting CodeMeter runtime to license the tool, which you do in GoPxL Manager. For more information, see Installing Licensing Software. |
|
|
The Surface Anomaly Detector toolset only runs on GoMax ORIN / ORIN+ and on PC. For information on getting and uploading a GoMax firmware that provides this tool, see the GoMax ORIN / ORIN+ user manual. |
The GoPxL Anomaly Detector toolset, which is part of LMI's new GoPxL Pro Tools, lets you train and deploy AI-powered anomaly detection in parts and surfaces in scan data produced by a compatible Gocator sensor.
The toolset includes the following:
-
The Surface Anomaly Detector tool: This tool provides an AI-based model training routine and an inference engine that uses a trained model to predict whether something in production scan data is an anomaly. The training routine steps you through the process of training on "good" (OK) and "bad" (NG) example frames. The tool can also simulate part orientation and acquisition variations, as well as synthetic NG frames to improve model performance.
-
The Training Archive tool: An auxiliary tool that conditionally saves frames to a project created in Surface Anomaly Detector, letting you improve the model on scan data acquired at a later time. For information on the Training Archive tool, see Training Archive.
The toolset supports both 2D intensity and 3D data. Surface Anomaly Detector runs on GoMax NX / ORIN / ORIN+ hardware accelerators or on PC. You must install a special firmware that includes the tool on your GoMax unit, and the on-sensor firmware version must match the GoMax firmware version.
Sample datasets are available in a package on LMI's Download page. For more information, see Sample Files.
|
|
The Anomaly Detector tool can be used with all Gocator sensors, except G1 sensors, G200 sensors, and G2300 revision A or B G2 models. |
Hardware and Software Requirements
The following hardware and software is required to use the GoPxL Anomaly Detector in production:
-
One or more compatible Gocator 3D sensors: G2, G3, G4, or G5. Note that GoPxL can only accelerate a single G3 sensor.
-
A GoPxL Anomaly Detector license and dongle, inserted into a USB port on the GoMax unit or PC.
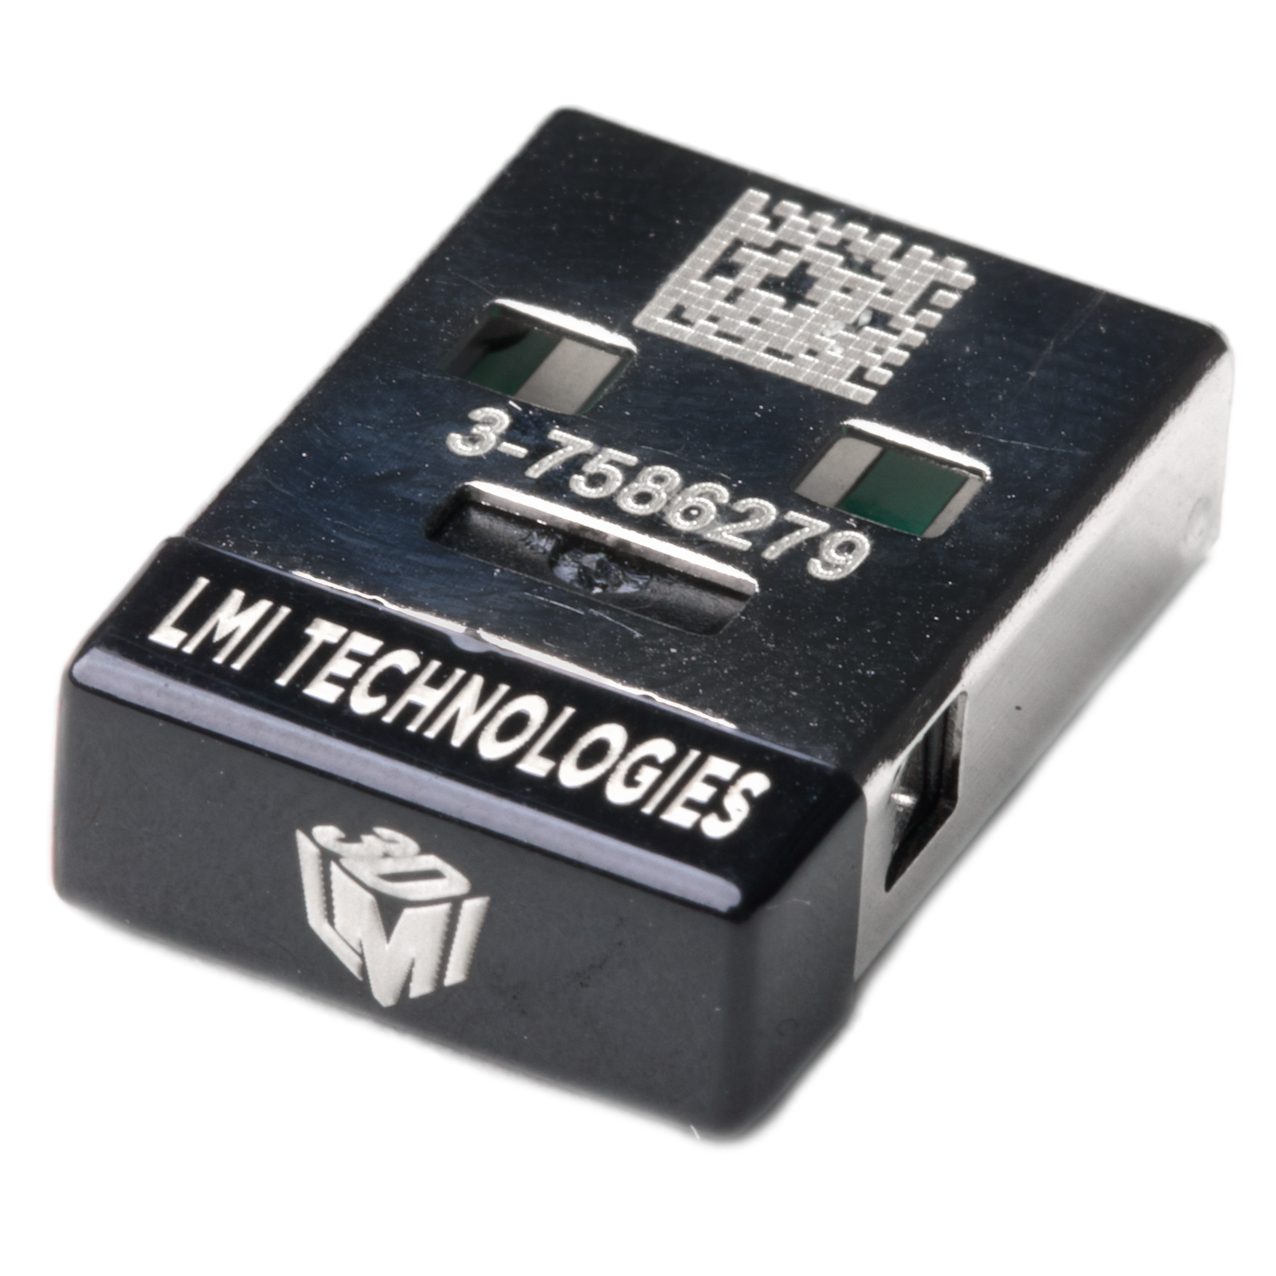
A license and dongle are required for running the tool on live scan data. Without the dongle, you can only evaluate the tool on previously scanned data. The tool will also display an error message without a dongle:
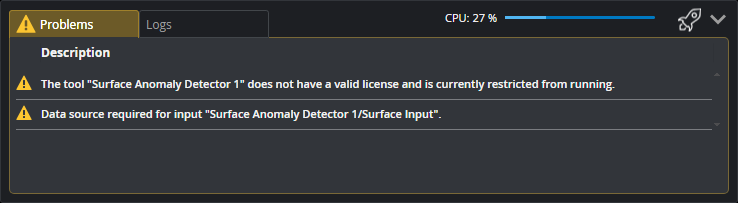
Plugging in the license dongle will license the tool. If the sensor system is running when you insert the dongle (that is, acquiring scan data), you must stop the system before it will license the tool.
-
A GoMax NX, GoMax ORIN, or GoMax ORIN+ accelerator, depending on scan resolution, cycle time and pre- or post-processing requirements.
GoPxL Anomaly Detector can also run on a PC. If you choose to run GoPxL Anomaly Detector on a PC instance of GoPxL, the PC must have a graphics card with a recent Nvidia GPU that supports Nvidia GeForce Game Ready Driver version 528.33 or higher, and a compute capability of 7.5 or higher. The latest Blackwell Architecture GPUs are not supported (including GeForce RTX 50 Series) are currently not supported but will be supported in GoPxL 1.3. To verify the driver version of your video card, launch the NVIDIA Control Panel, and in the main panel of the application, make note of the driver version. To exceed the capabilities of GoMax ORIN in terms of training times and inference, an RTX 4070 or higher is recommended.
Note the following general requirements for running GoPxL on a PC: - Processor: x86-64 (Core i3 or equivalent)
- RAM: 8 GB
- Hard drive: 64 GB
- Operating system: Windows 10 (32-bit and other OS are not supported)
- Display: 1366 x 768
-
A special version of GoPxL that includes GoPxL Anomaly Detector for GoMax or for PC.
You can find the appropriate version of GoPxL on LMI's Product Downloads page (https://lmi3d.com/product-downloads/).For GoMax, choose "Gocator" as the Product Brand, and then choose GoMax under Product Family, and your model under "Product Series." Under "Choose Software Release," choose a release that specifies Anomaly Detector. Scroll to find the firmware.
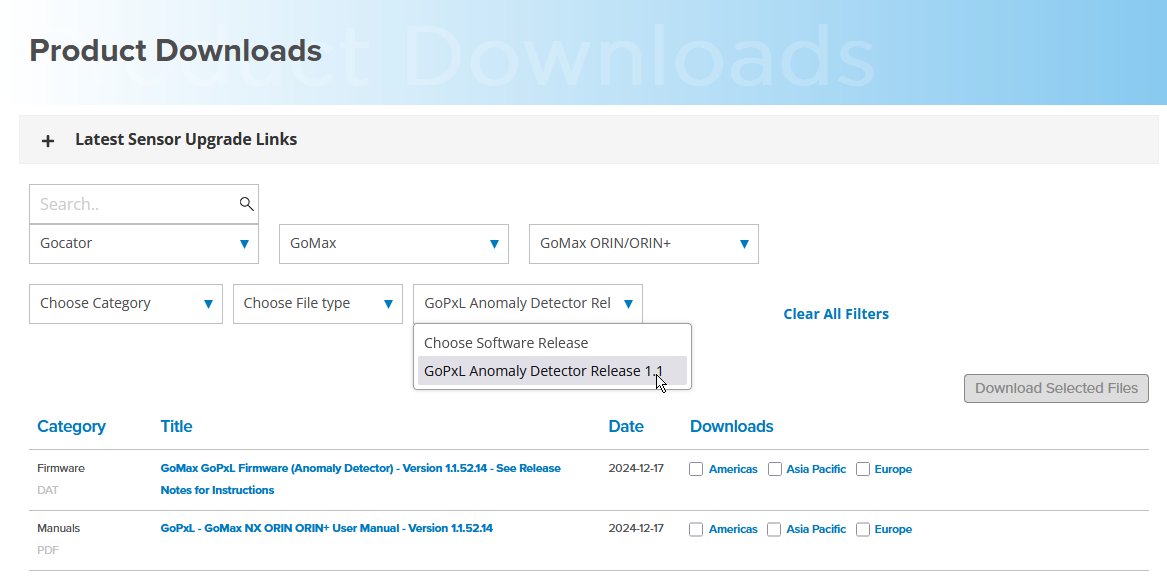
For sensors and GoPxL for PC, under "Product Family," choose your the family of your sensor. Scroll to find the firmware and software, respectively.
-
If you are running GoPxL Anomaly Detector on a PC, a version of the CodeMeter runtime that is compatible with the dongle and license is required.
You install the runtime in GoPxL Manager; for more information, see Installing the CodeMeter Runtime on a Windows PC.
Installing the CodeMeter Runtime on a Windows PC
If you are using the Anomaly Detector toolset on a PC, you must the CodeMeter runtime, which is required by the GoPxL Anomaly Detector license and dongle. You install the runtime from GoPxL Manager.
To install the CodeMeter runtime
| 1. | If GoPxL it is not already running, start GoPxL Manager. |
For more information, see Running GoPxL on a Windows PC.
| 2. | Stop any running instances of GoPxL. |
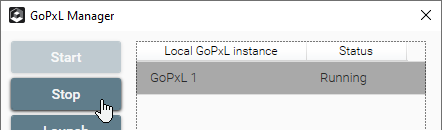
When an instance stops, its status becomes "Not running."
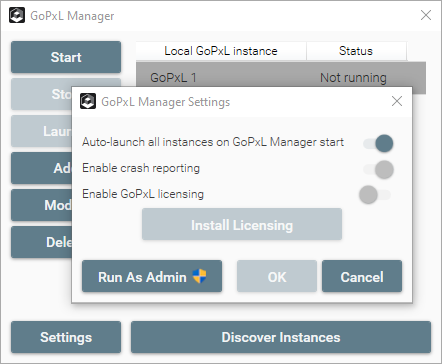
| 3. | Click Settings, and in the GoPxL Manager Settings dialog, click Run As Admin. |
| 4. | Answer Yes in the dialog that appears. |
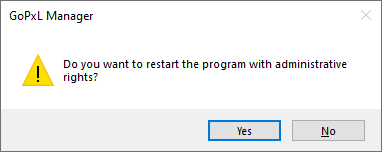
You will need to click Yes in the User Account Control dialog.
| 5. | Click Settings again, and in the dialog, toggle on Enable GoPxL licensing and click Install Licensing. |
The CodeMeter Runtime setup wizard launches.
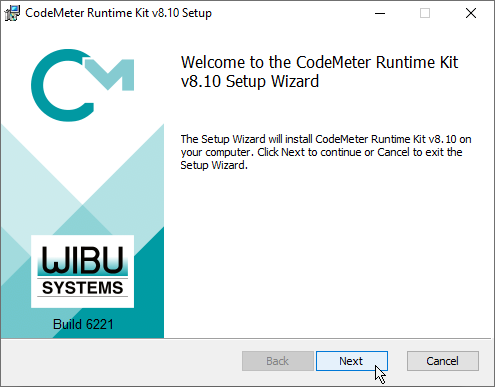
| 6. | Go through the steps in the wizard to install the runtime. |
You will need to accept the license agreement before continuing with the installation, and choose whether CodeMeter will be installed for all users on the PC. Leave the defaults in the Custom Setup step.
If you no longer need to use Anomaly Detector on your PC, remove the licensing software:
| 1. | On your PC desktop, in the Search field, type "Add" and click "Add or remove programs" in the "Best match" list. |
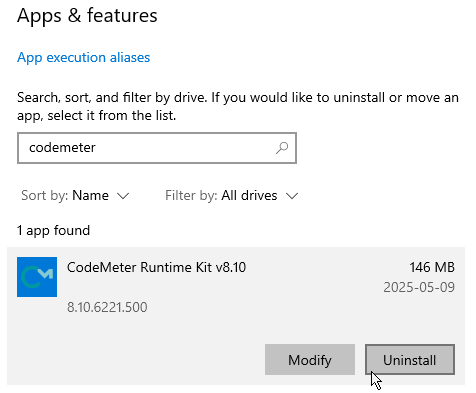
| 2. | In the "Search this list" field, type "codemeter", click CodeMeter Runtime Kit to expand it, click Uninstall, and follow the instructions. |
Inputs
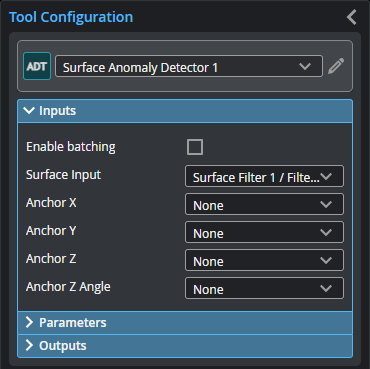
You configure the tool's inputs in the expandable Inputs section.
|
|
To use a measurement as an anchor, it must be enabled and properly configured in the tool providing the anchor. For more information on anchoring, see Measurement Anchoring. |
| Name | Description |
|---|---|
| Enable Batching |
For more information on arrays, batching, and aggregating, see Arrays, Batching, and Aggregation. |
|
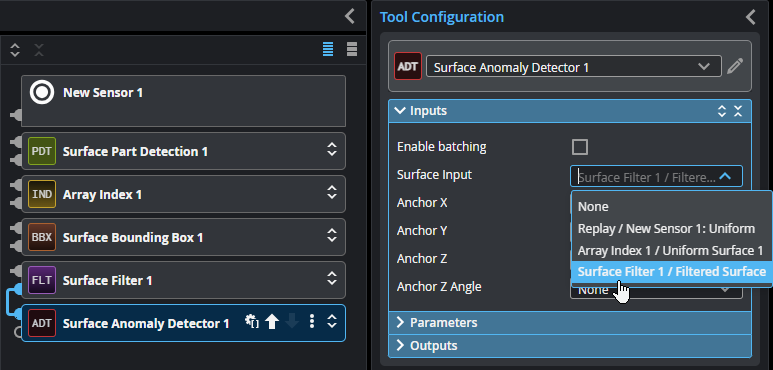
Surface Input |
The data the tool applies measurements to or processes. This tool can optionally take an array as input. For more information, see Arrays, Batching, and Aggregation. |
|
Anchor X Anchor Y Anchor Z |
The X, Y, or Z measurement of another tool that this tool uses as a positional anchor. Positional anchors are optional. |
| Anchor Z Angle |
The Z Angle measurement of another tool to use as a rotational anchor for this tool. Rotational anchors are optional. |
Parameters
You configure the tool's parameters in the expandable Parameters section.
| Parameter | Description |
|---|---|
|
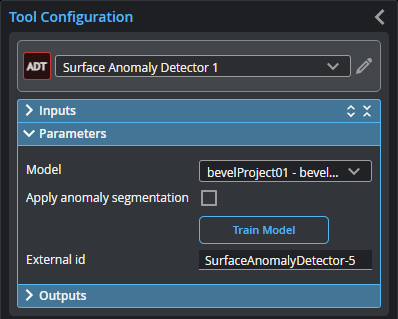
Model |
Chooses the trained model the tool uses to detect anomalies during production. |
| Apply anomaly segmentation |
When you set Model to a previously trained model, this parameter is available. When you enable this parameter the tool, configure the parameters in Segmentation parameters (see below). |
| Segmentation parameters |
The parameters that control anomaly output.
Threshold Offset The offset that determines whether data is considered an anomaly.
Open kernel X Open kernel Y The X and Y kernel size, respectively, for morphological opening to remove small areas of data. Use these settings, for example, to remove bridges between areas to properly isolate them or to remove small areas entirely (perhaps caused by noise). Use different values of X and Y to use a non-rectangular filter to adapt the kernel to the kinds of unwanted data you see in the scan data.
Close kernel X Close kernel Y The X and Y kernel size, respectively, for morphological closing to fill in holes smaller than the specified kernel size. Use these settings, for example, to fill small areas within potential anomalies that may be caused by drop-outs. Use different values of X and Y to use a non-rectangular filter to adapt the kernel to the kinds of holes you see in the scan data.
Use area filter If Use Area Filter is enabled, the tool applies an area filter to anomalies using the values you provide in Max area and Min area.
Ordering Orders the measurements, features, and surface data of the individual anomalies output by the tool. One of the following:
|
|
Train Model |
Starts the model training routine, which steps you through process. For more information, see Train Model. |
|
External ID |
The external ID of the tool that appears in GoHMI Designer. For more information, see GoHMI and GoHMI Designer. |
Development Workflow
The high level workflow is as follows:
| 1. | Collect representative scans of the part you need to inspect in order to train an Anomaly Detector model. In addition to "good" parts, you need to scan "bad" parts, that is, ones with typical defects. |
| 2. | Create a pre-processing toolchain and train an Anomaly Detector model on GoMax. |
| 3. | Deploy the Anomaly Detector model and connect post-processing tools. |
| 4. | Optionally, collect new production data for model retraining on a GoMax. |
Collect dataset
Unless you are using a previously created dataset, you must create the dataset that the GoPxL Anomaly Detector will use for training a model before it can detect anomalies in new production data. To do this, perform the following steps:
| 1. | Record representative scans of 20 or more OK targets (targets with no flaws) and 20 or more NG targets (targets with flaws). |
You can record the scans to a single .gprec file or to multiple files. If you record scans to a single file, grouping each type (OK and NG) together will make it easier to label them later in the wizard. Make sure there are no empty frames: each frame should contain either an OK or an NG target. Do not rely on .gpsup or .rec for this as the Anomaly Detector wizard requires .gprec files when importing from PC.
| 2. | Save a separate .gpsup file with the sensor configuration settings such as exposure time and related imaging parameters. |
Ensure the same parameters are used on the production system. Otherwise, you will need to collect new training data.
Implement a Preprocessing Toolchain
The preprocessing tool chain limits variation in the scan data to the region or surface of interest (with and without anomalies). With less variation in the scan data, the total number of frames needed for training is reduced.
The preprocessing tool chain must not change between training and inference. Otherwise, the system will not function properly. You must save your preprocessing toolchain in the .gpsup file created previously or using a separate .gpjob file.
|
|
You must use the same preprocessing toolchain for training and inference to ensure proper detection of anomalies. |
Train Model
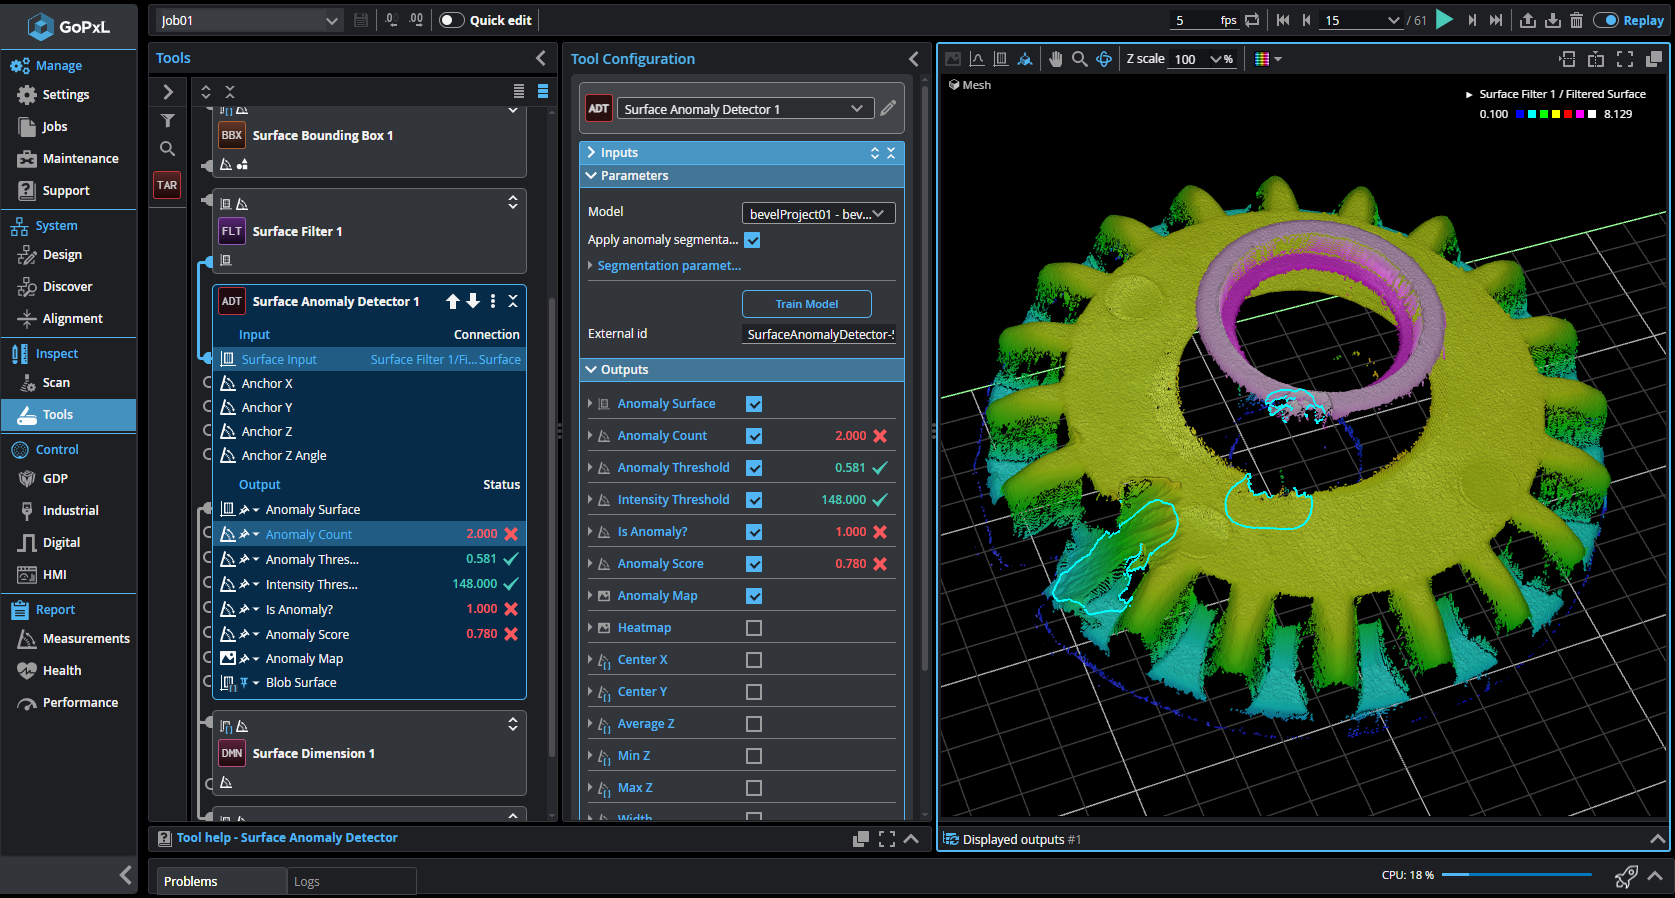
Add Surface Anomaly Detector Tool
| 1. | Add and connect a Surface Anomaly Detector tool to the output of the preprocessing tool chain. |
In the following the first four tools in the Tool Diagram on the left are the preprocessing tool chain. The last tool in the chain, Surface Filter, is used as input for the Anomaly Detector tool.
| 2. | In tool's Parameters section, click the Train Model button. |
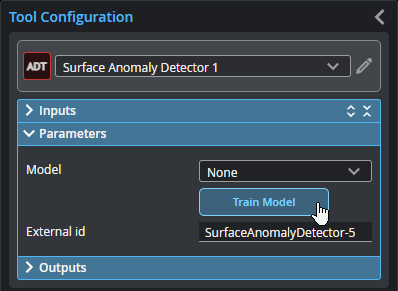
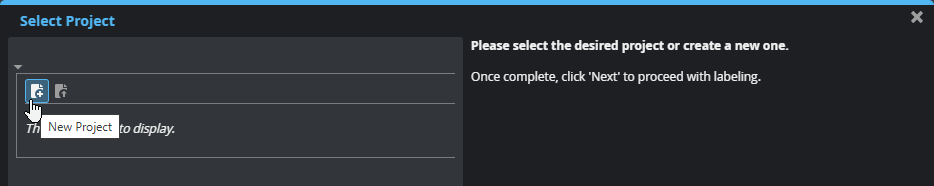
The routine starts and the Select Project page opens. You will create a new project in this page, or open a previously created project.
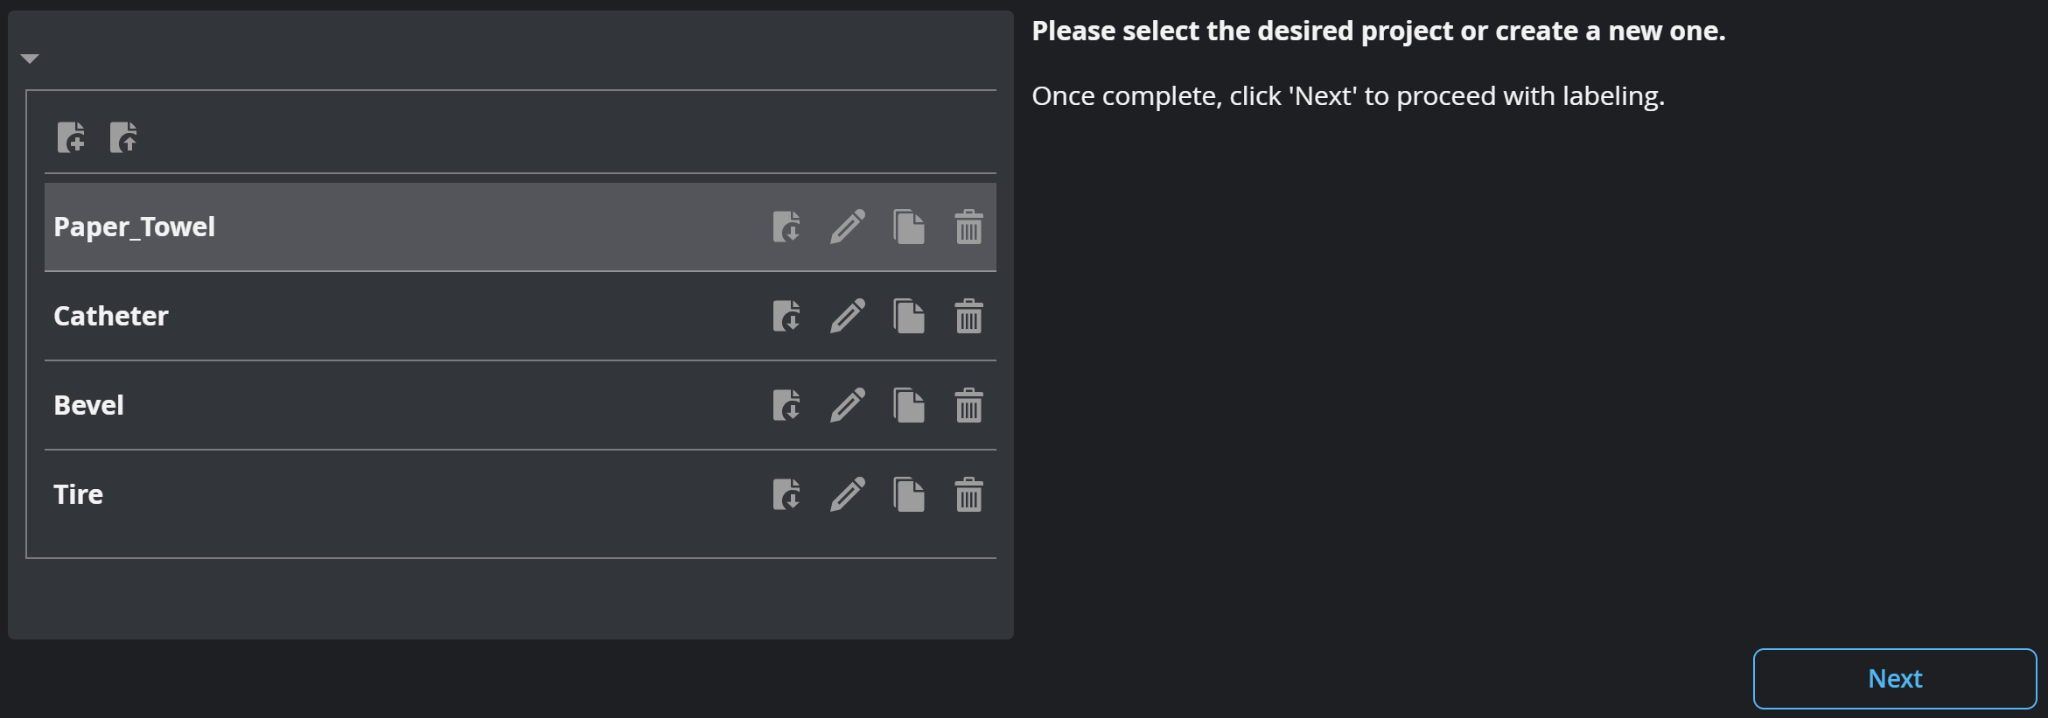
Create New or Open Project
A project is a collection of frames used for training, labels you apply to those frames (OK and NG), and the models trained on those frames. You should choose a meaningful project name, such as the part name, especially when working with multiple projects.
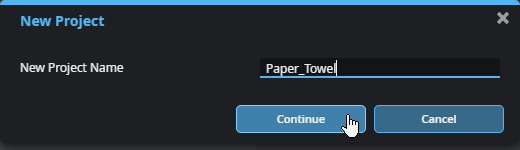
| 1. | On the Select Project page, click the New Project icon, provide a project name, click Continue, and then click Next. |
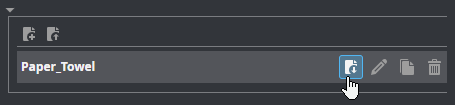
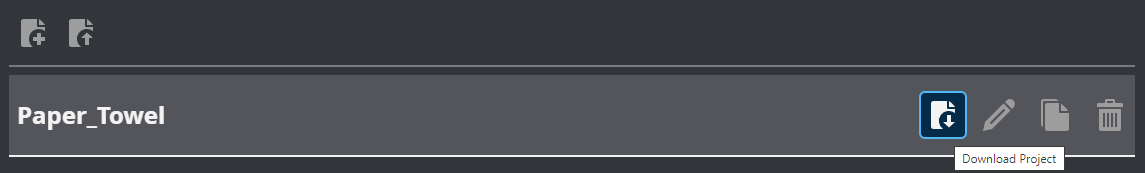
Use the download icon on a project's row to download this to your PC and upload to another device.
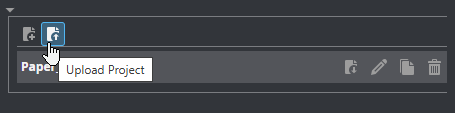
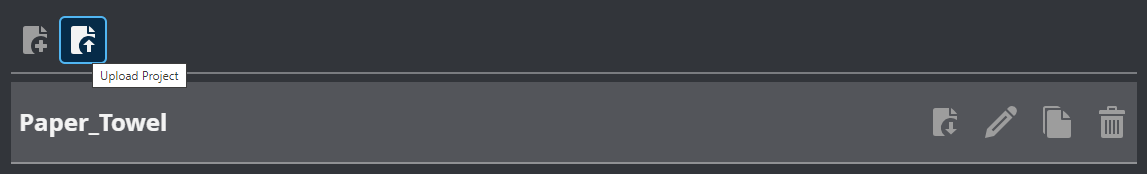
Use the upload icon to import a previously downloaded project.
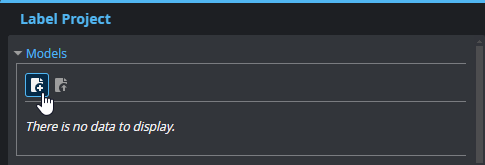
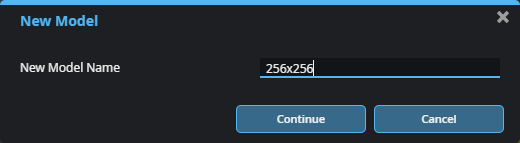
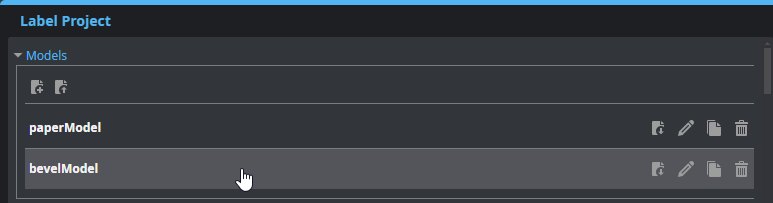
| 2. | In the Label Project page, in the Models section, create a new model and click Continue. |
| 3. | (Optional) To download a project to the connected PC in order to upload it to another GoMax accelerator, click the Download icon on a project's row . |
| 4. | (Optional) Click the Upload icon to import a previously downloaded project. |
| 5. | In the Frames section, do one of the following |
- To upload currently loaded replay data, click the Upload Replay Data button (
 ) , and then click Continue.
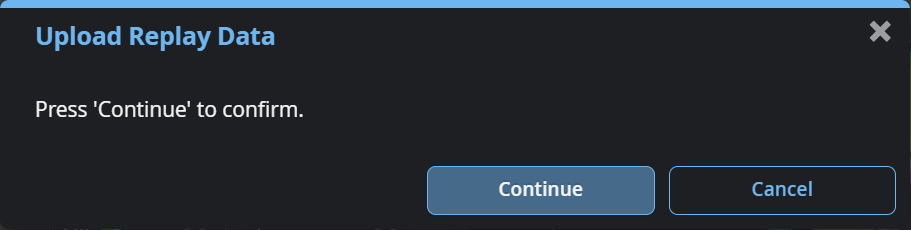
- To upload the data from a .gprec file on the local PC, click the Upload From Disk button (
 ), choose a file in the Open dialog a, click Open.
The tool loads the frames into the model.

|
Loading replay data into the project can take several minutes. If a “Delayed Response” message displays, click “Wait.” In this case, add a Decimation Filter to the pipeline. |
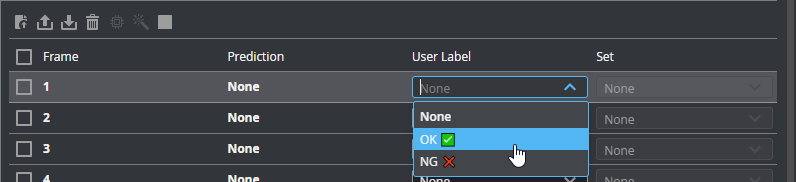
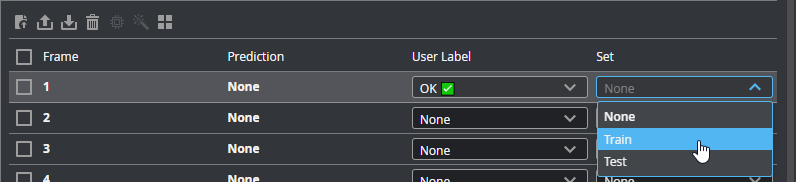
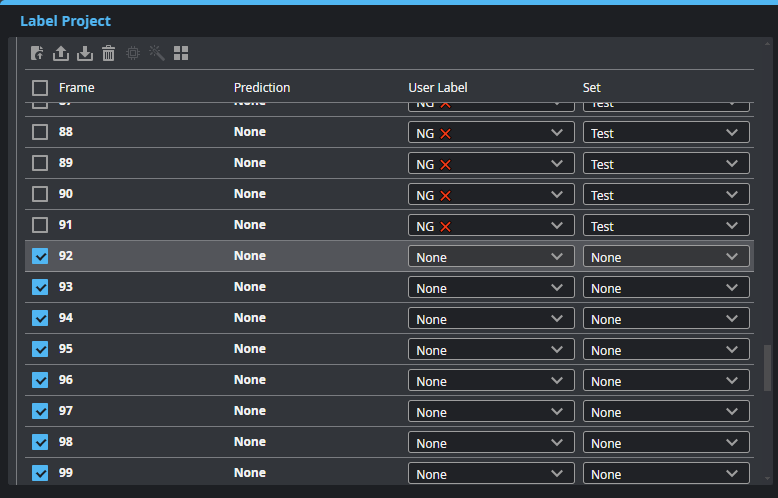
Label Frames and Choose Set
You must now label each frame as “OK” or “NG” (under the User Label column). You must also choose the set each frame belongs to (Train or Test, under the Set column).
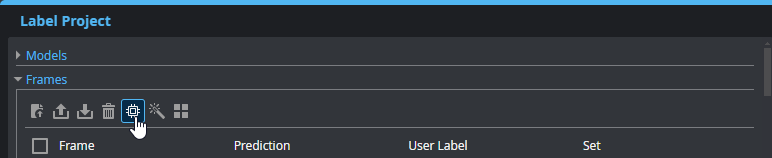
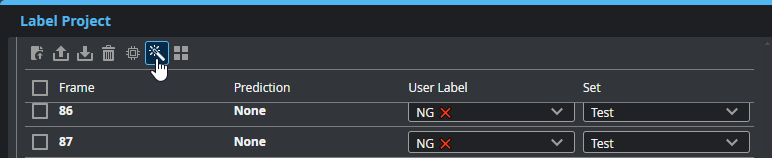
| 1. | (Optional) To have the system automatically place frames in the Train or Test set, click the Auto-split icon. |
The Set column will become read only. When you set a frame's user label, the tool assigns it to the sets in the proportions described below.

Auto-split uses the proportions recommended for training to place each frame into a set:
80% of OK is in Train
20% of OK is in Test
100% of NG is in Test
You can also enable auto-split after setting the user labels.
| 2. | In the row of each frame, under User Label, choose the correct label. |
If you have not enabled auto-split, also choose the frame's set under Set. Make sure you use the proportions described in step 1.
To quickly choose the label and set for multiple frames, do one of the following to first select the frames:
- To select a range of frames, click the checkbox of the first frame, press Shift, and click the checkbox of the last frame of the range.
- To select multiple frames, click the checkbox of the first frame, press Ctrl, and click the checkbox for each frame you want to select.
- To select non-contiguous ranges, alternate between clicking Ctrl and Shift.
After selecting the frames, choose the label and the set as described above. To deselect all frames, click anywhere between the checkbox and the User Label and Set drop-down menus.
| 3. | Click Train Model to configure training. |
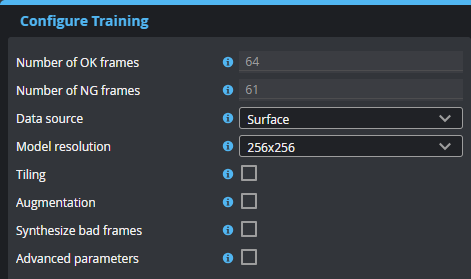
Configure Training
After labeling the frames and choosing the set they belong to, you must configure training. For descriptions of the settings, see below.
| Parameter | Description |
|---|---|
|
Number of OK images Number of NG images |
Read-only fields that display the number of frames you have labeled OK and NG, respectively. |
|
Data source |
The source the tool uses during training: Surface or, if available, Intensity data. You use Surface data for defects detectable on a 3D surface (that is, using height data). You use Intensity data for defects on flat surfaces, such as printing flaws. For more information on scan modes, see Scan Modes and Intensity. |
| Model resolution | Decimates the input data to the specified resolution for processing. A higher resolution improves anomaly location accuracy but increases processing time for training. For most applications, leave this at 256x256. |
| Tiling |
Enables tiling. Tiling divides the frames of training data into sections. The tool uses the same model for each tile, which increases the resolution of the model. This lets the tool potentially find smaller defects or increase detection accuracy. You should only use tiling with homogenous targets (for example, paper towel, wood decking, and so on) or symmetric targets. For discrete parts with a complex or asymmetric shape, disable this setting. After enabling tiling, set the number of vertical and horizontal tiles. You can also set tiles to overlap in Tile margin. Use this to detect anomalies that might fall on a boundary between tiles. Generally, you should use a value between 12.5% and 25%. Note that using tiling and tiling margins increases the memory requirements for training considerably. For example, with 5x5 tiling, the tool uses 25 times more memory. |
| Augmentation |
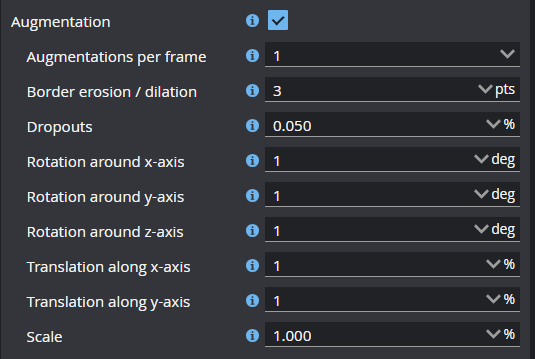
When Augmentation is enabled, the tool simulates random part orientation, size, and acquisition variations to generate more training data, which improves training. The rotation, translation, and scale values are used to create a range. So for example, a Z axis rotation value of 1 degree results in a range between -1 and 1, from which the tool chooses a random value to generate data. For Dropouts, the value represents the upper limit of the range between 0 and the provided percentage. Choose augmentations that are representative of the variations you encounter during production. Augmentations that aren't representative may lead to poor results. You can visualize example augmentations on the Model Performance page, which is available after training is complete; for more information, see Test Model Performance.
Augmentations per frame The number of augmentations generated for each frame in the project (OK and NG). Augmentations are not added to the total number of frames in the project itself.
Border erosion / dilation Performs erosion and dilation operations on each frame. Set to 1 or higher for discrete parts, and set to 0 for continuous surfaces or when using a pre-processing pipeline that crops the input surface.
Dropouts Removes data points randomly to simulate low exposure, up to the specified percentage of the original scan data. Set this to 0 if you are using gap filling or don't expect exposure issues.
Rotation settings The Rotation settings limit rotation of simulated data around the X, Y, and Z axis.
Translation settings The Translation settings limit movement of simulated data on the XY plane, as a percentage of the data points in the frame.
Scale Limits the scaling of simulated data. |
| Synthesize bad frames |
When this setting is enabled, the tool synthesizes bad (NG) frames from the good (OK) frames in the project. The frames are used internally during training and are not added to the frames in the project or shown in the tool. The following are examples of synthesized frames:
Enable this setting if your project contains very few NG frames. The setting is automatically enabled if the project contains no NG frames. |
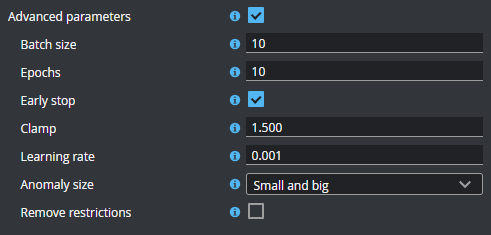
| Advanced parameters |
If the training results are generally good but the tool is reporting a small number of false positives or false negatives, you can modify these parameters to further improve results.
Batch size
The number of frames in a batch (a subset of the entire dataset passed to the training algorithm for an iteration). If you are using a model with a 512x512 resolution or tiling and the tool has memory issues during training, decrease this value.
Epochs The number of times the entire dataset passes through the training algorithm. To reduce false positives or negatives, increase this value. Note that training will take longer.
Early stop Leave enabled for the initial training runs. To help model performance, disable to improve model performance; note that training will take longer.
Clamp The range within which the data values should be clamped. Reduce this value to help reduce false positives or false negatives.
Learning rate Set this to a higher value to reduce training time. Note that a value that is too high can cause the model to miss the point where the difference between predicted and actual OK / NG is at its smallest (that is, overshooting it). A lower value causes the model to learn more slowly, but potentially more accurately; if the value is too low, the model can get stuck.
Anomaly size One of the following: Small and big, Big, Small. Choose Big to reduce false positives caused by smaller features like reflections or drop-outs. Choose Small to ignore large features in the data. For most applications, leave this as Big and small.
Remove restrictions By default, this option is disabled, and the following limitations are in place to ensure the system trains successfully and does not run out of memory:
|
After you configure training, click Start Training to train the model. The tool will start by preparing the training data, providing progress feedback:
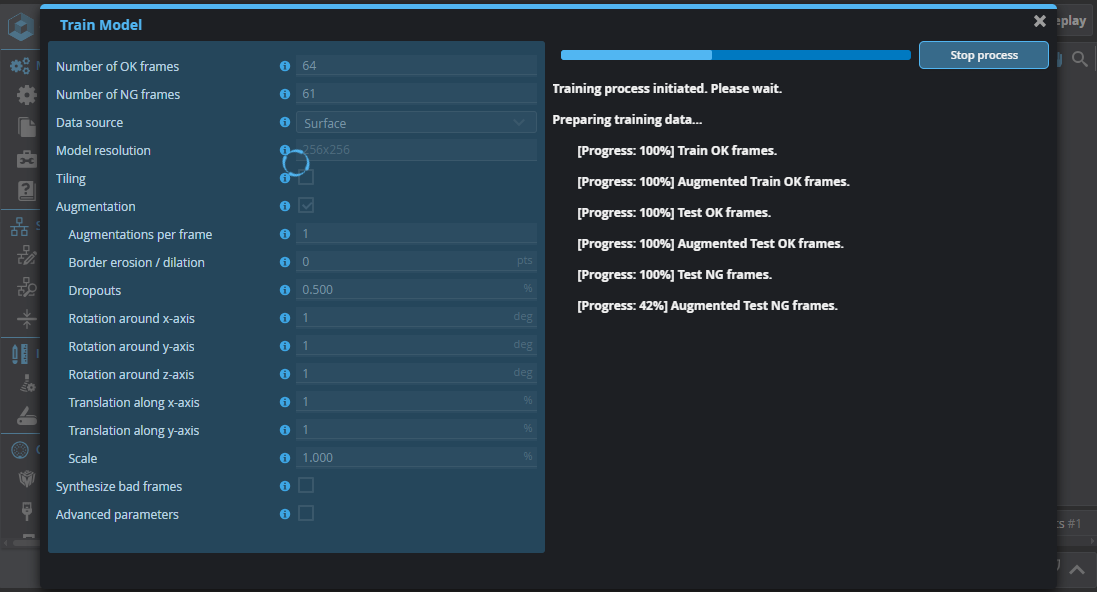
After the data is prepared, the tool will start generating Loss and AUROC graphs.
Loss: This graph represents the cumulative error for each frame in the Test set, determined after each training run iteration or epoch. A decreasing number (the graph's line is moving down) implies the model is improving.
AUROC: This graph defines how well the model can distinguish between the OK and NG user labels. A value of 1 (the graph's line is moving up) represents the best possible result.
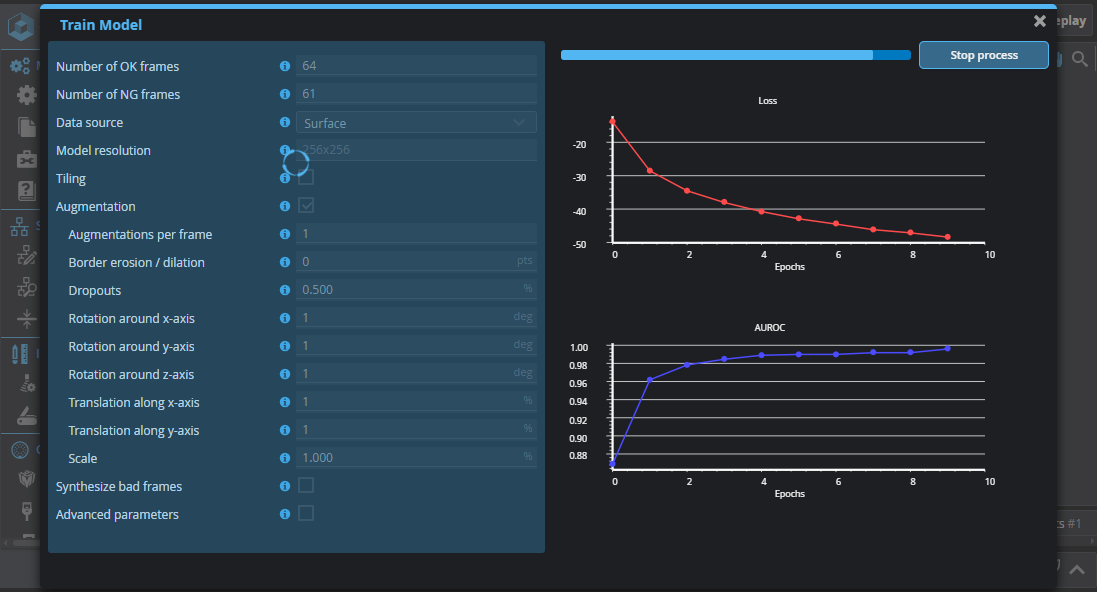
As the tool trains the model on the labeled frames, the graphs should converge, that is, Loss will decrease, and AUROC will increase, approaching 1 (the best possible result). After the training has completed, click Next to test the model. Note that training can take several minutes.
Test Model Performance
After the tool has finished training the model, it will use the model to make predictions on the frames to determine the anomaly score for each frame, as well as the anomaly threshold. The Model Performance page displays the following results:
| Name | Description |
|---|---|
|
Model |
The trained model the tool used to detect anomalies during the model performance phase. |
|
True Positive Rate |
The percentage of frames correctly predicted as OK. |
| False Positive Rate | The percentage of frames incorrectly predicted as OK. |
| False Negative Rate | The percentage of frames incorrectly predicted as NG. |
| Processing Time | The average time required for inference. Includes the pre-processing tool chain. |
| Anomaly Threshold |
The threshold to which a frame's Anomaly Score measurment is compared to determine whether the frame is an anomaly. An anomaly score above this value is an anomaly. |
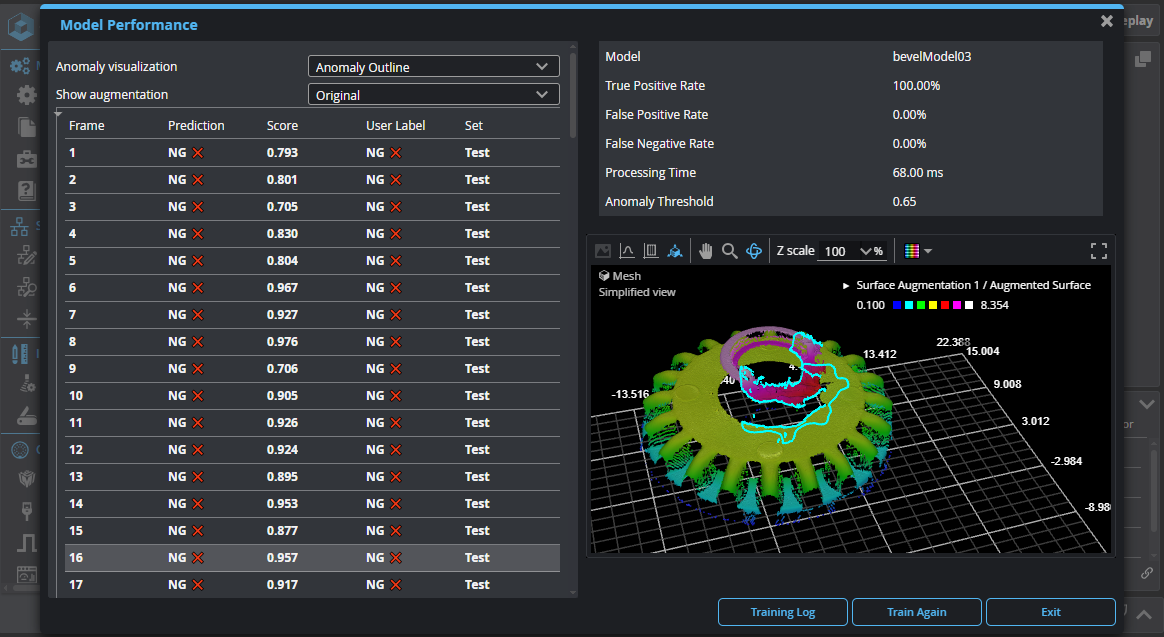
You can use the Anomaly visualization drop-down to view different visualizations of the selected frame:
| Name | Description |
|---|---|
|
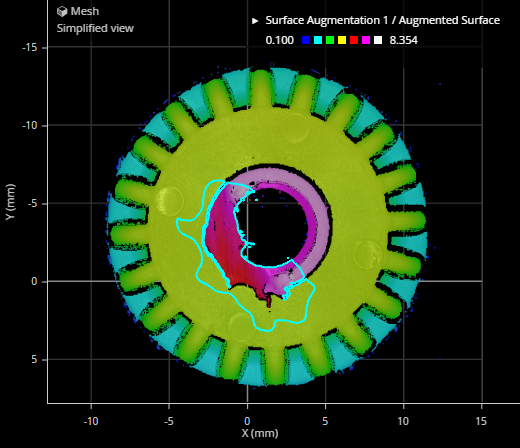
Anomaly Outline |
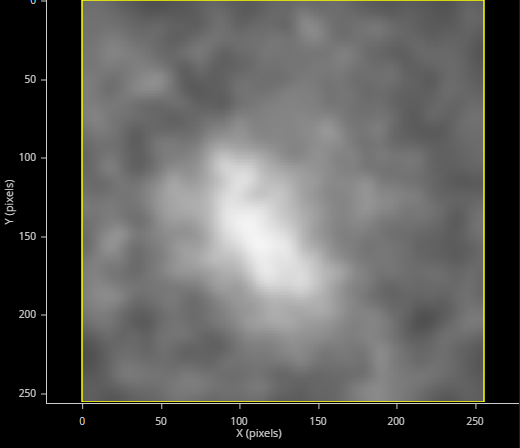
Displays the Surface data of the frame with anomalies outlined, if present.
|
|
Heatmap |
A diagnostic Image output overlaying the Anomaly Map output on the input data. This output can make it easier to see whether the brighter areas in the anomaly map correspond with flaws in the target.
|
| Anomaly Map |
A diagnostic Image output that contains grayscale values representing a per-pixel score of how anomalous that pixel is. Brighter areas should correspond to flaws. When Anomaly Map is passed to segmentation tools such as Surface Blob, the data can be used to locate and measure the size of the anomalies.
|
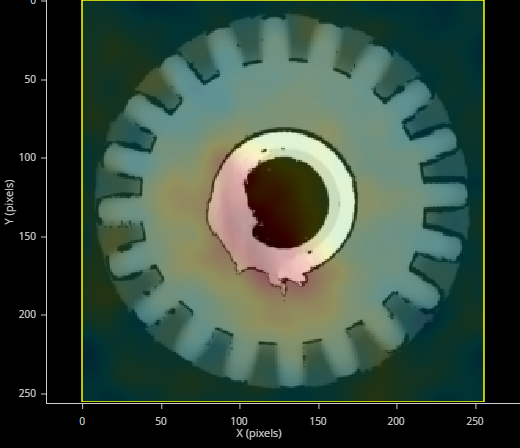
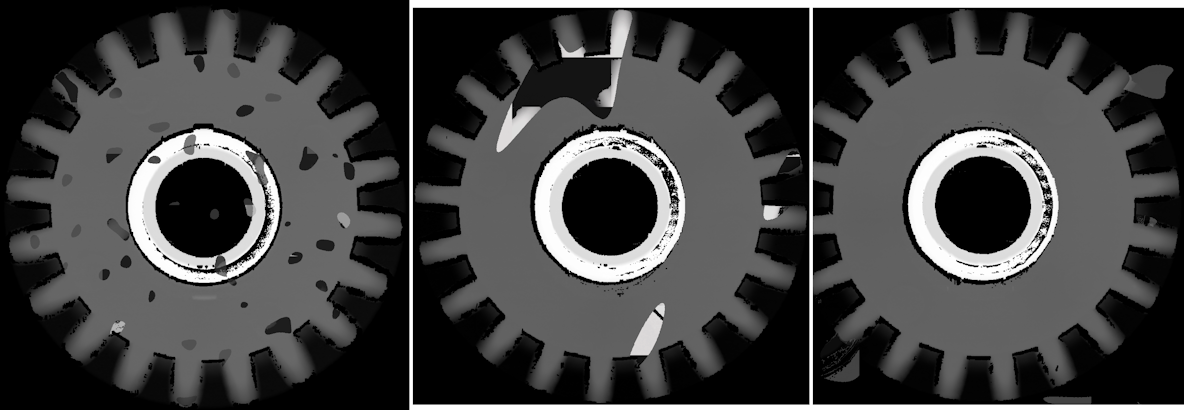
If you have enabled augmentations in the training configuration, you can use the Show augmentations drop-down to switch between a frame's original scan data and a simulated frame to get an idea of the effect of the augmentation settings. Note that the augmentations the tool shows are not the ones used in training, which are generated randomly during training using the provided ranges. Also, the score displayed in the selected row is the original frame's score, not the augmented frame. The following options are available:
| Name | Description |
|---|---|
|
Original |
The frame's original scan data. |
|
Upper Limit Lower Limit |
These options display a frame with maximum and minimum augmentation values applied to the scan data, respectively. Note that the maximum / minimum values are determined by the settings in the Configure Training step of the routine. For example, if you have set the Z axis rotation to 1 degree, Upper Limit will show the frame rotated 1 degree clockwise. Lower Limit will show the frame rotated 1 degree counter clockwise. For Border erosion / dilation, Upper Limit and Lower Limit show the effect of dilation and erosion operations, respectively, using the provided kernel size. If you have enabled dropouts (by setting the Dropouts slider in the training configuration to a non-zero value), with Upper Limit, the tool removes a random selection of data points using the percentage provided. With Lower Limit (which is equivalent to 0% in the setting), no data points are removed. |
| Random |
The tool applies random values chosen from the augmentation ranges provided during the Configure Training step. |
The Model Performance page also lets you download a tar archive containing reports and other diagnostics. You typically only need to do this if asked to do so by LMI Support.
You can also retrain the model with different training configuration if you wish.
You are now ready to use the trained model on new scan data in production.
Deploy in production
Anomaly Tool Setup
| 1. | Connect to the GoMax using a laptop or PC on the same network. |
| 2. | Upload a .gpsup or .gprec file created during the dataset collection. |
Ensure the recording contains the same preprocessing pipeline used during training.
| 3. | Discover the Gocator sensor and create a new sensor group. |
| 4. | Insert the GoPxL Anomaly Detector USB dongle to a USB port on the GoMax. |
| 5. | In the Surface Anomaly Detector tool, in Model, choose the model you trained and want to use in production. |
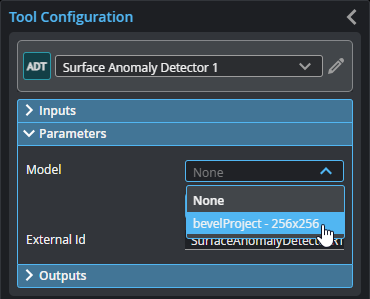
| 6. | Configure the outputs as required, and implement post-processing to isolate and prepare anomalies for measurement. For more information, see Outputs and Surface Anomaly Detector. |
Outputs
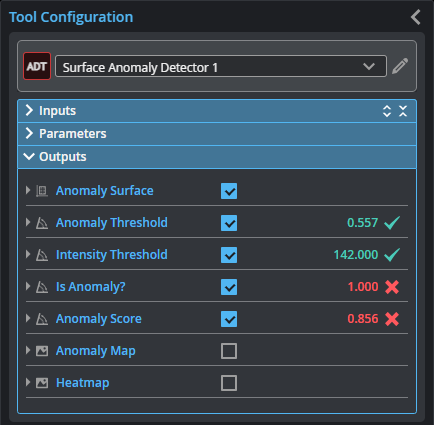
Outputs section with a measurement expanded to show user-configurable decision min/max fields and an external ID
Although the tool has several outputs, the "Is Anomaly" measurement and "Anomaly Surface" output are the main outputs intended for processing by tools later in the tool chain.
You configure the Min and Max parameters by expanding the measurement in the Outputs section. In order for a measurement to return a Pass decision, the measurement must be between maximum and minimum values; the range is inclusive.
Some outputs are only displayed if Apply anomaly segmentation is enabled in the Parameters section.
| Measurement |
|---|
|
Anomaly Count The number of anomalies detected in the frame. |
|
Anomaly Threshold Threshold value (0..1) of the ‘Anomaly Score’ above which the model considers an input surface anomalous. This value is determined during training to achieve the best possible detection rate. |
|
Intensity Threshold A grayscale value in the ‘Anomaly Surface’ intensity data above which the model considers input intensity data anomalous. The value is constant for a trained model. The value is equivalent to ‘Anomaly Threshold’ x 255 and rounded to the nearest integer. |
|
Is Anomaly? Indicates whether the tool has detected an anomaly in the current frame of scan data. |
|
Anomaly Score Indicates how strongly the tool believes the current frame contains an anomaly. When the value is higher than the Anomaly Threshold measurement, this measurement is set to 1.0. |
|
Center X Center Y Arrays of the X and Y positions of the centers of mass of the anomalies in the frame. |
|
Average Z An array of the average Z positions of the anomalies in the frame. |
|
Min Z Max Z Arrays of the minimum and maximum Z positions of the anomalies in the frame. |
|
Width Length Arrays of the length and width of the rotated bounding boxes that encapsulate the anomalies in the frame. These are always the major and minor axis of a blob, respectively. |
|
Area An array of the areas of the anomalies in the frame. The area is calculated using the contour of the blob and resampling. For this reason, areas calculated using the Surface Volume tool will produce different measurements; for more information, see Area. |
| Type | Description |
|---|---|
| Anomaly Surface |
Contains the Surface data of the frame, with the anomaly map (see Anomaly Map below) added as intensity data. The intensity data represents a per-pixel score of how anomalous that pixel is. |
| Anomaly Map |
Diagnostic Image output containing the output anomaly map in the form that is produced by the deep learning inference algorithm. Brighter areas should correspond to flaws. |
| Heatmap | Diagnostic Image output overlaying the Anomaly Map output on the input scan data. This output can make it easier to see whether the brighter areas in the anomaly map correspond with flaws in the target. |
| Blob Surface | An array containing the frame's anomalies. Pass these to other tools for measurement or further processing. |
Store production data
You can use the Training Archive tool to conditionally add frames to a Surface Anomaly Detector project. For more information, see Training Archive.
Train using additional data
After adding new frames to a project using the Training Archive tool (see Training Archive) or uploading additional frames manually (from the replay buffer or from a .gprec file), you can further train the model with new frames, taking advantage of the trained model's prediction capabilities to automatically label frames as OK or NG.
To train using new data:
| 1. | After adding frames to a project, go to the Label Project page. |
| 2. | Select the new frames. |
| 3. | Choose the correct model you want to use for prediction. |
| 4. | At the top of the Frames section, click the Generate Prediction button. |
The tool uses the selected model to generate predictions (OK or NG) for the selected, unlabeled frames. Note that the user labels of the frames are unchanged at this point.
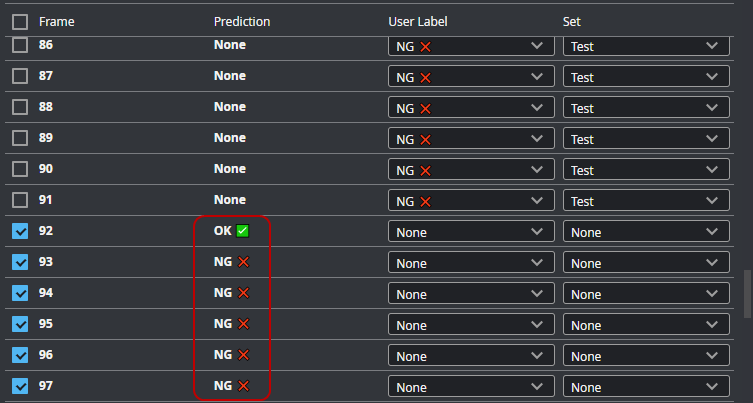
| 5. | Review the predictions and do the following: |
| a. | Uncheck any invalid predictions. |
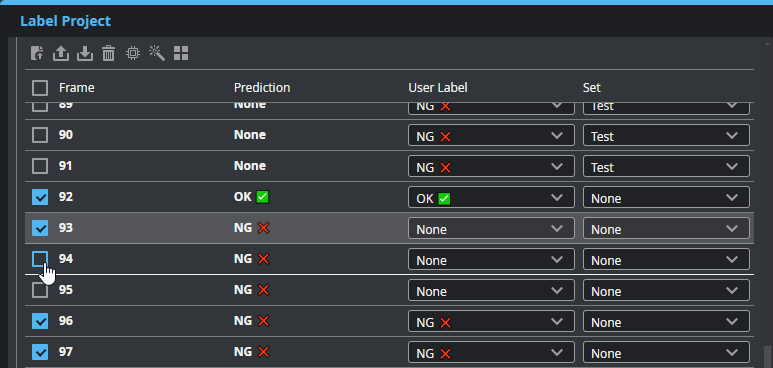
| b. | Click the Apply Prediction button. |
| c. | Toggle Auto-Split to On to automatically set the Set of the selected frames. |
| d. | Manually set the user label of any incorrectly predicted frames. |
The predictions of the selected frames are copied to the user label drop-down.
| 6. | Retrain the model with the newly added frames. |
For more information, see Train Model.